How to Check Memory Usage?
1. cat /proc/meminfo#
/proc/meminfo is a virtual file that reportss the amount of available and used
memory. It contains real-time information about the system’s memory usage as
well as the buffers and shared memory used by the kernel.
ubuntu@jason-aws-ec2-5:~$ cat /proc/meminfo
MemTotal:        1002052 kB
MemFree:          176848 kB
MemAvailable:     651564 kB
Buffers:           63744 kB
Cached:           517708 kB
SwapCached:            0 kB
Active:           487052 kB
Inactive:         165456 kB
Active(anon):      83344 kB
Inactive(anon):       88 kB
Active(file):     403708 kB
Inactive(file):   165368 kB
Unevictable:       21940 kB
Mlocked:           18528 kB
SwapTotal:             0 kB
SwapFree:              0 kB
Dirty:                 0 kB
Writeback:             0 kB
AnonPages:         93036 kB
Mapped:            86356 kB
Shmem:               808 kB
KReclaimable:      66656 kB
Slab:             122980 kB
SReclaimable:      66656 kB
SUnreclaim:        56324 kB
KernelStack:        2348 kB
PageTables:         1992 kB
NFS_Unstable:          0 kB
Bounce:                0 kB
WritebackTmp:          0 kB
CommitLimit:      501024 kB
Committed_AS:     665324 kB
VmallocTotal:   34359738367 kB
VmallocUsed:        9316 kB
VmallocChunk:          0 kB
Percpu:            12864 kB
HardwareCorrupted:     0 kB
AnonHugePages:         0 kB
ShmemHugePages:        0 kB
ShmemPmdMapped:        0 kB
FileHugePages:         0 kB
FilePmdMapped:         0 kB
CmaTotal:              0 kB
CmaFree:               0 kB
HugePages_Total:       0
HugePages_Free:        0
HugePages_Rsvd:        0
HugePages_Surp:        0
Hugepagesize:       2048 kB
Hugetlb:               0 kB
DirectMap4k:      114688 kB
DirectMap2M:      933888 kB
2. free#
free displays the amount of Physical and Swap memory.
ubuntu@jason-aws-ec2-5:~$ free
              total        used        free      shared  buff/cache   available
Mem:        1002052      177096      176848         808      648108      651564
Swap:             0           0           0
The data represents the used/available memory and the swap memory figures in kilobytes.
total: Total installed memory
used: Memory currently in use by running processes (used= total – free – buff/cache)
free: Unused memory (free= total – used – buff/cache)
shared: Memory shared by multiple processes
buffers: Memory reserved by the OS to allocate as buffers when process need them
cached: Recently used files stored in RAM
buff/cache: Buffers + Cache
available: Estimation of how much memory is available for starting new applications, without swapping.
3. vmstat#
The vmstat command is a useful tool that reports virtual memory statistics.
vmstat provides general information about processes, memory, paging, block IO, traps, and CPU activity.
ubuntu@jason-aws-ec2-5:~$ vmstat
procs -----------memory---------- ---swap-- -----io---- -system-- ------cpu-----
 r  b   swpd   free   buff  cache   si   so    bi    bo   in   cs us sy id wa st
 0  0      0 176848  63752 584444    0    0     1     5    3    3  0  0 100  0  0
The detailed description listed below provides an explanation for each value in case you need assistance in analyzing the results.
Procs
r: number of processes waiting for run time.
b: number of processes in uninterruptible sleep.
Memory
swpd: amount of virtual memory used.
free: amount of idle memory.
buff: the amount of memory used as buffers.
cache: amount of memory used as cache.
Swap
si: memory swapped in from disk (/s).
so: memory swapped to disk (/s).
IO
bi: Blocks received from a block device (blocks/s).
bo: Blocks sent to a block device (blocks/s).
System
in: number of interrupts per second, including the clock.
cs: number of context switches per second.
CPU – These are percentages of total CPU time.
us: Time spent running non-kernel code. (user time, including nice time)
sy: Time spent running kernel code. (system time)
id: Time spent idle. Before Linux 2.5.41, this includes IO-wait time.
wa: Time spent waiting for IO. Before Linux 2.5.41, included in idle.
st: Time stolen from a virtual machine. Before Linux 2.6.11, unknown.
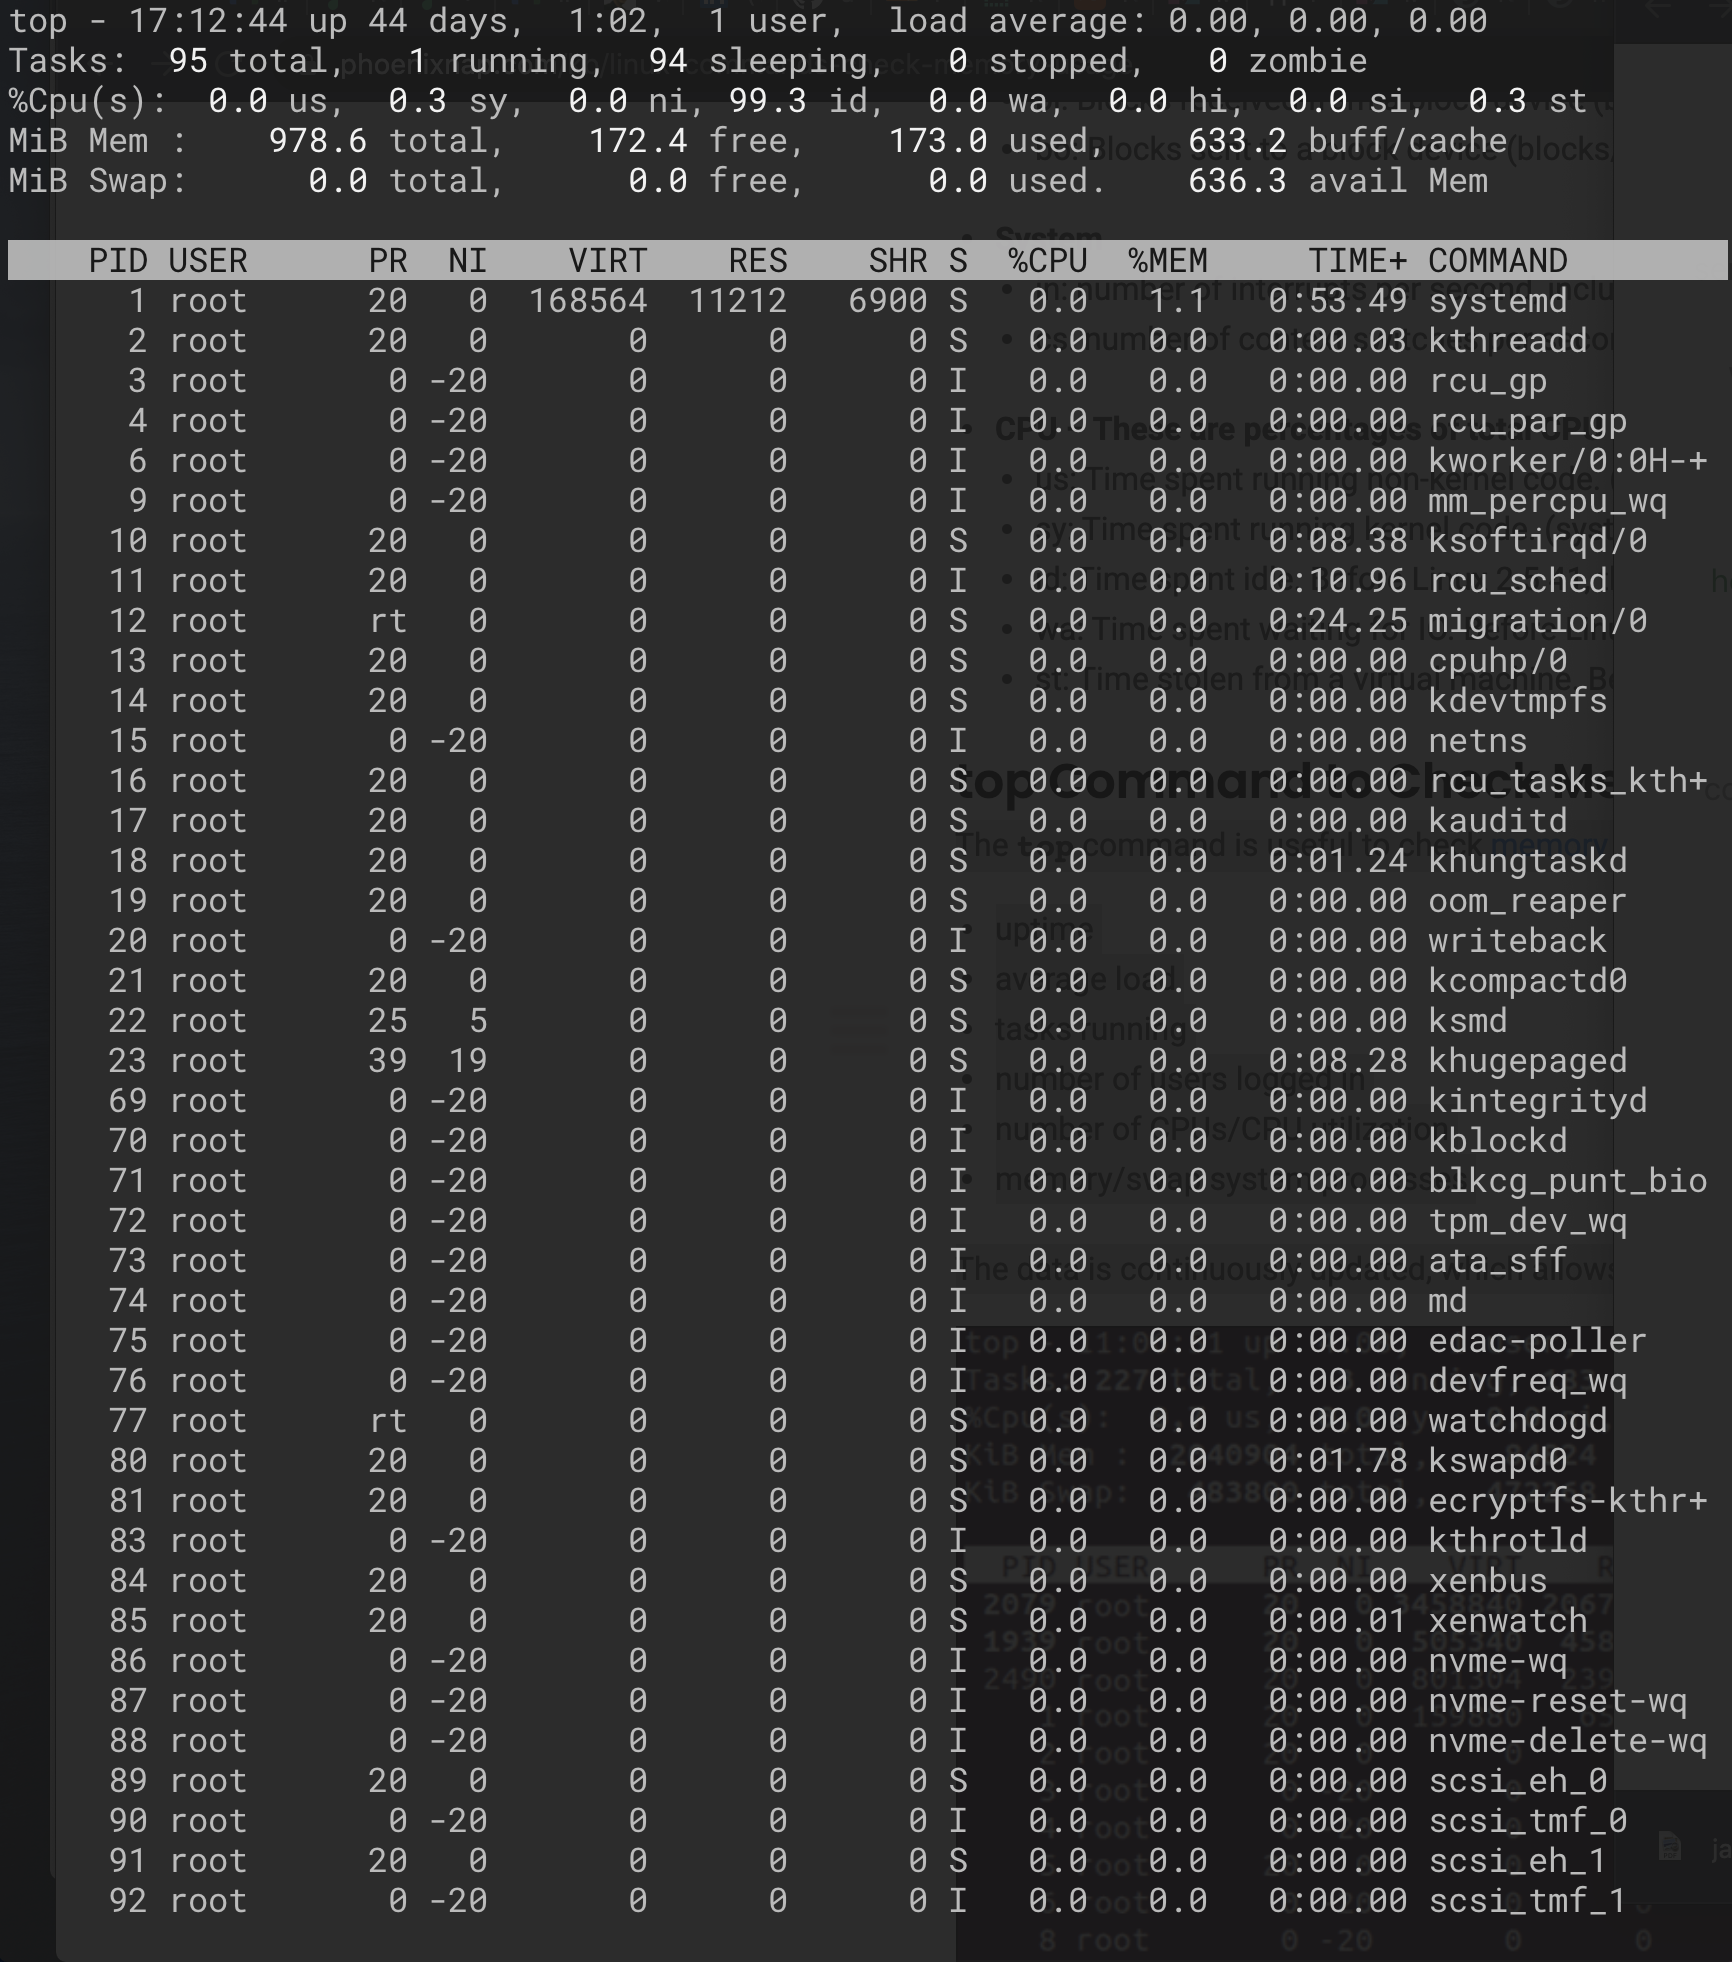
4. top#
The top command is useful to check memory and CPU usage per process. It displays information about:
- uptime
- average load
- tasks running
- number of users logged in
- number of CPUs/CPU utilization
- memory/swap system processes
- The data is continuously updated, which allows you to follow the processes in real-time.
5. htop#
The information the htop command provides is similar to the top command. However, the real advantage to the htop command is its user-friendly environment and improved controls.
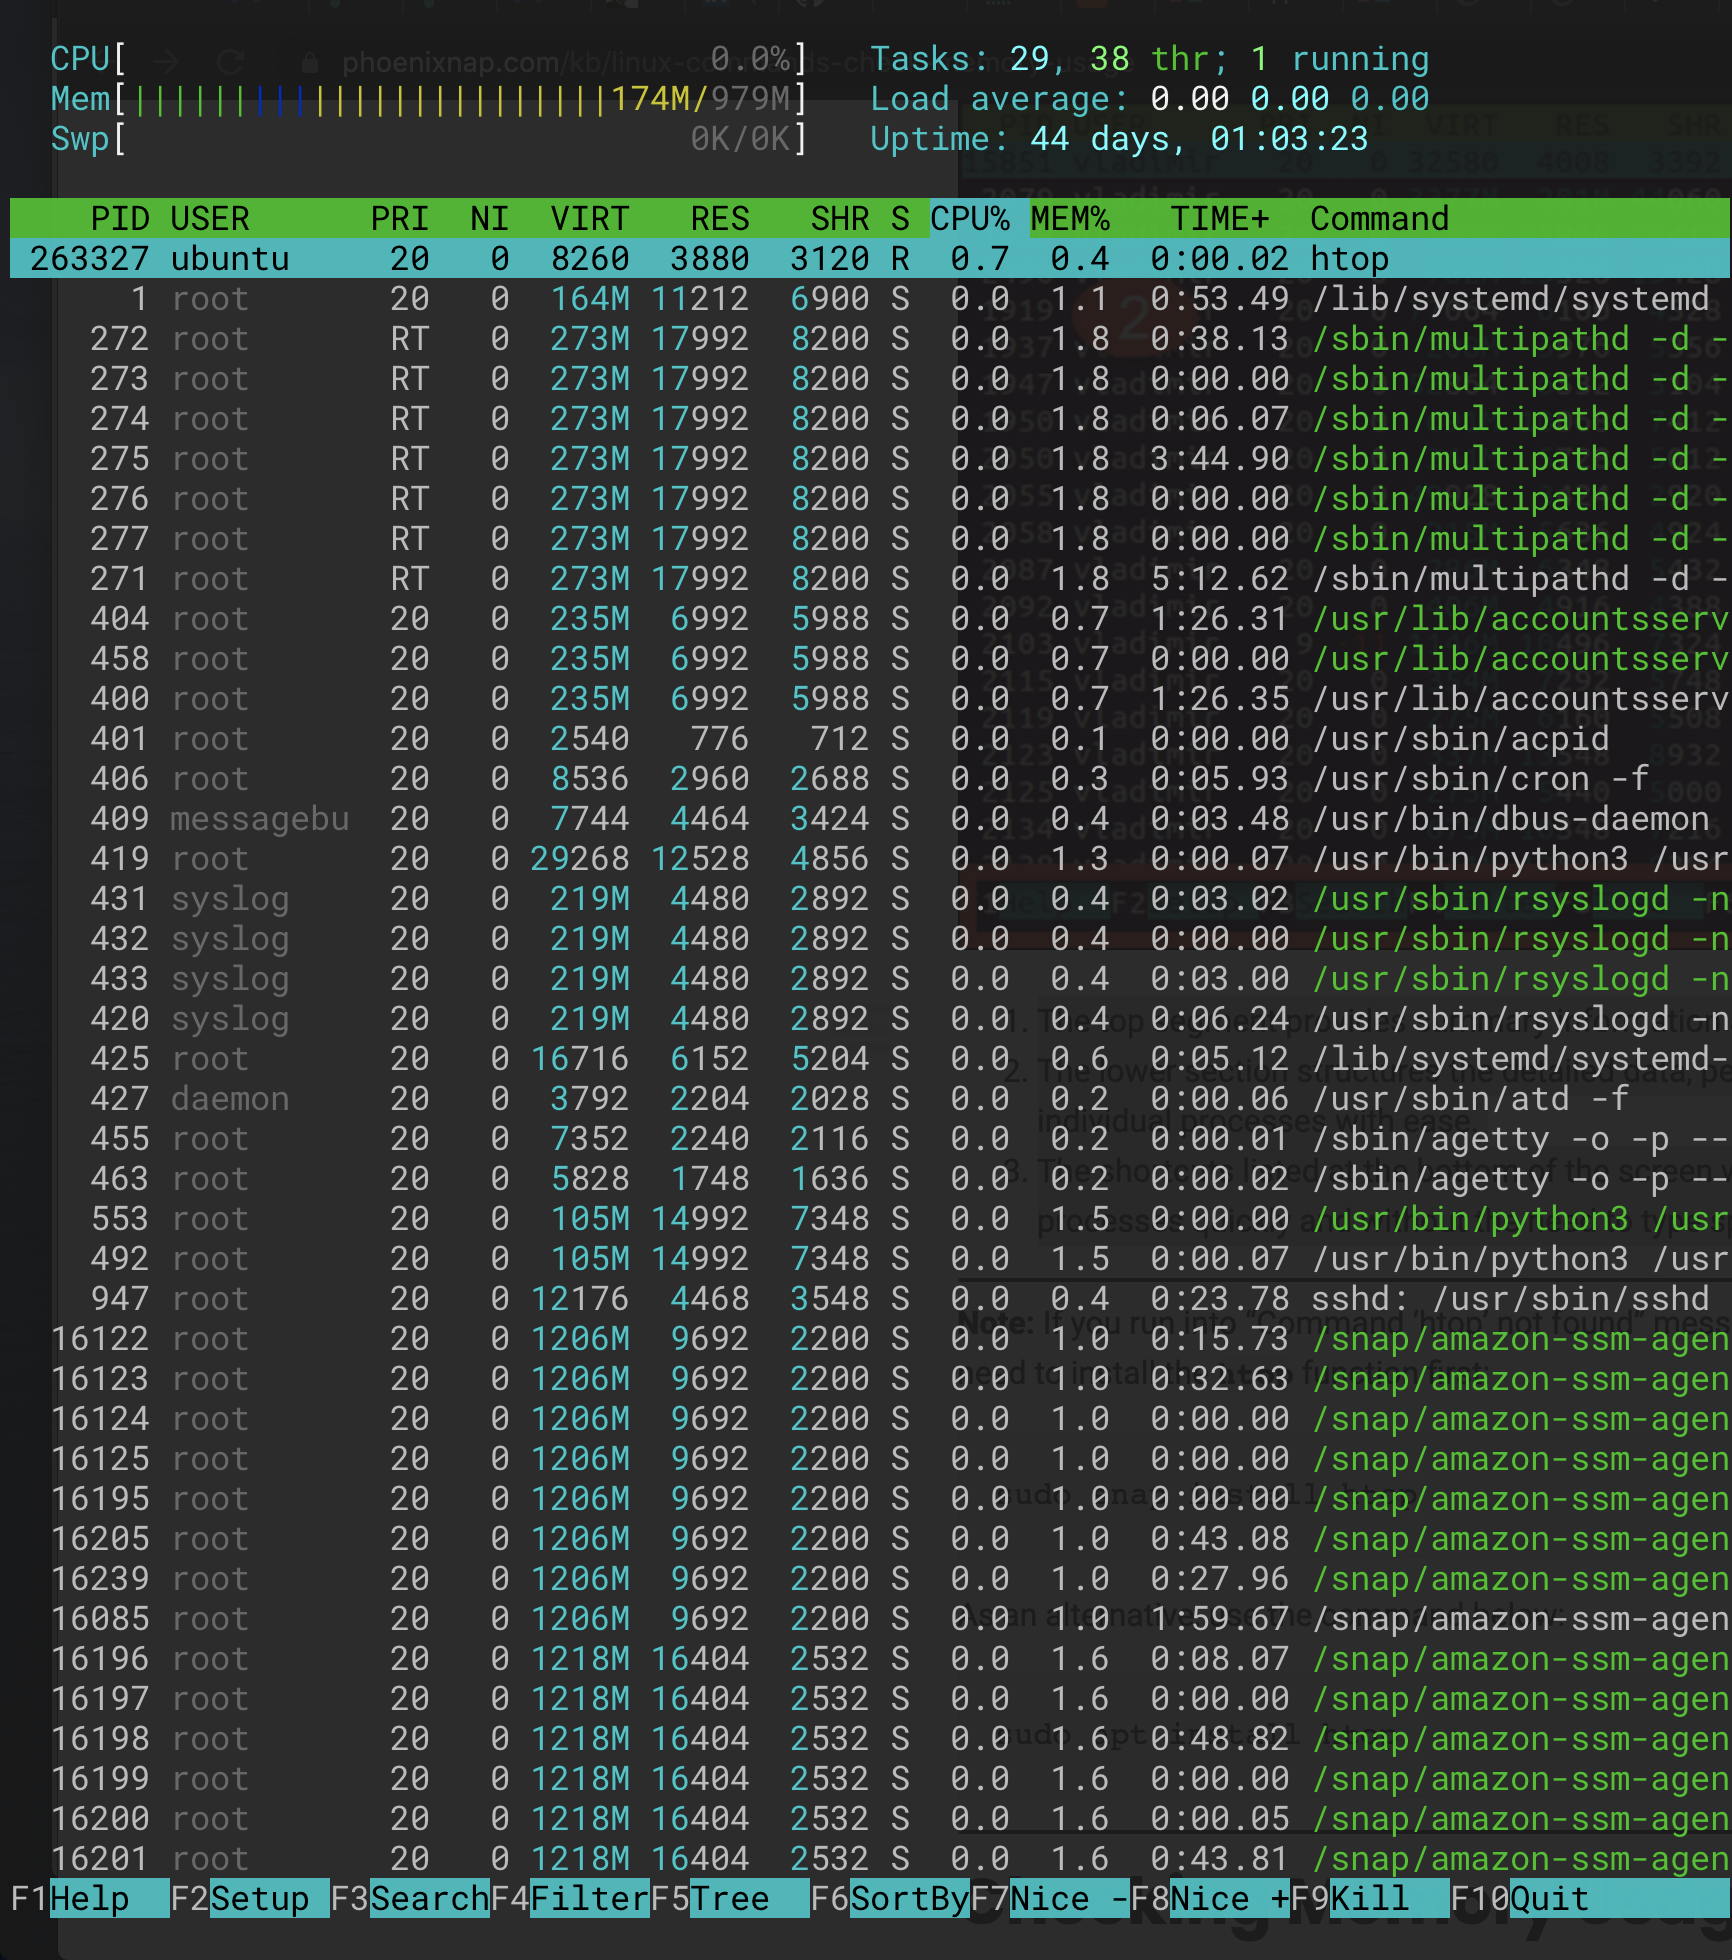
The top segment provides summary information and contains graphic meters and text counters.
The lower section structures the detailed data, per process. This allows you to perform actions on individual processes with ease.
The shortcuts listed at the bottom of the screen will enable you to manipulate and customize the processes quickly and without the need to type specific commands.