How to List Running Processes?
1. ps#
The ps command uses the following syntax:
$ ps [options]
Frequently used ps command options include:
a: List all ruining processes for all users.
-A, -e: List all processes on the system.
-a: List all processes except session leaders (instances where the process ID is the same as the session ID) and processes not associated with a terminal.
-d: List all processes except session leaders.
–deselect, -N: List all processes except those that fulfill a user-defined condition.
f: Displays process hierarchy as ASCII art.
-j: Displays output in the jobs format.
T: List all processes associated with this terminal.
r: Only list running processes.
u: Expand the output to include additional information, for example, CPU and memory usage.
-u: Define a user whose processes you want to list.
x: Include processes without a TTY.
You should see something like this:
$ ps

The default output includes the following categories:
PID: Process identification number. TTY: The type of terminal the process is running on. TIME: Total amount of CPU usage. CMD: The name of the command that started the process.
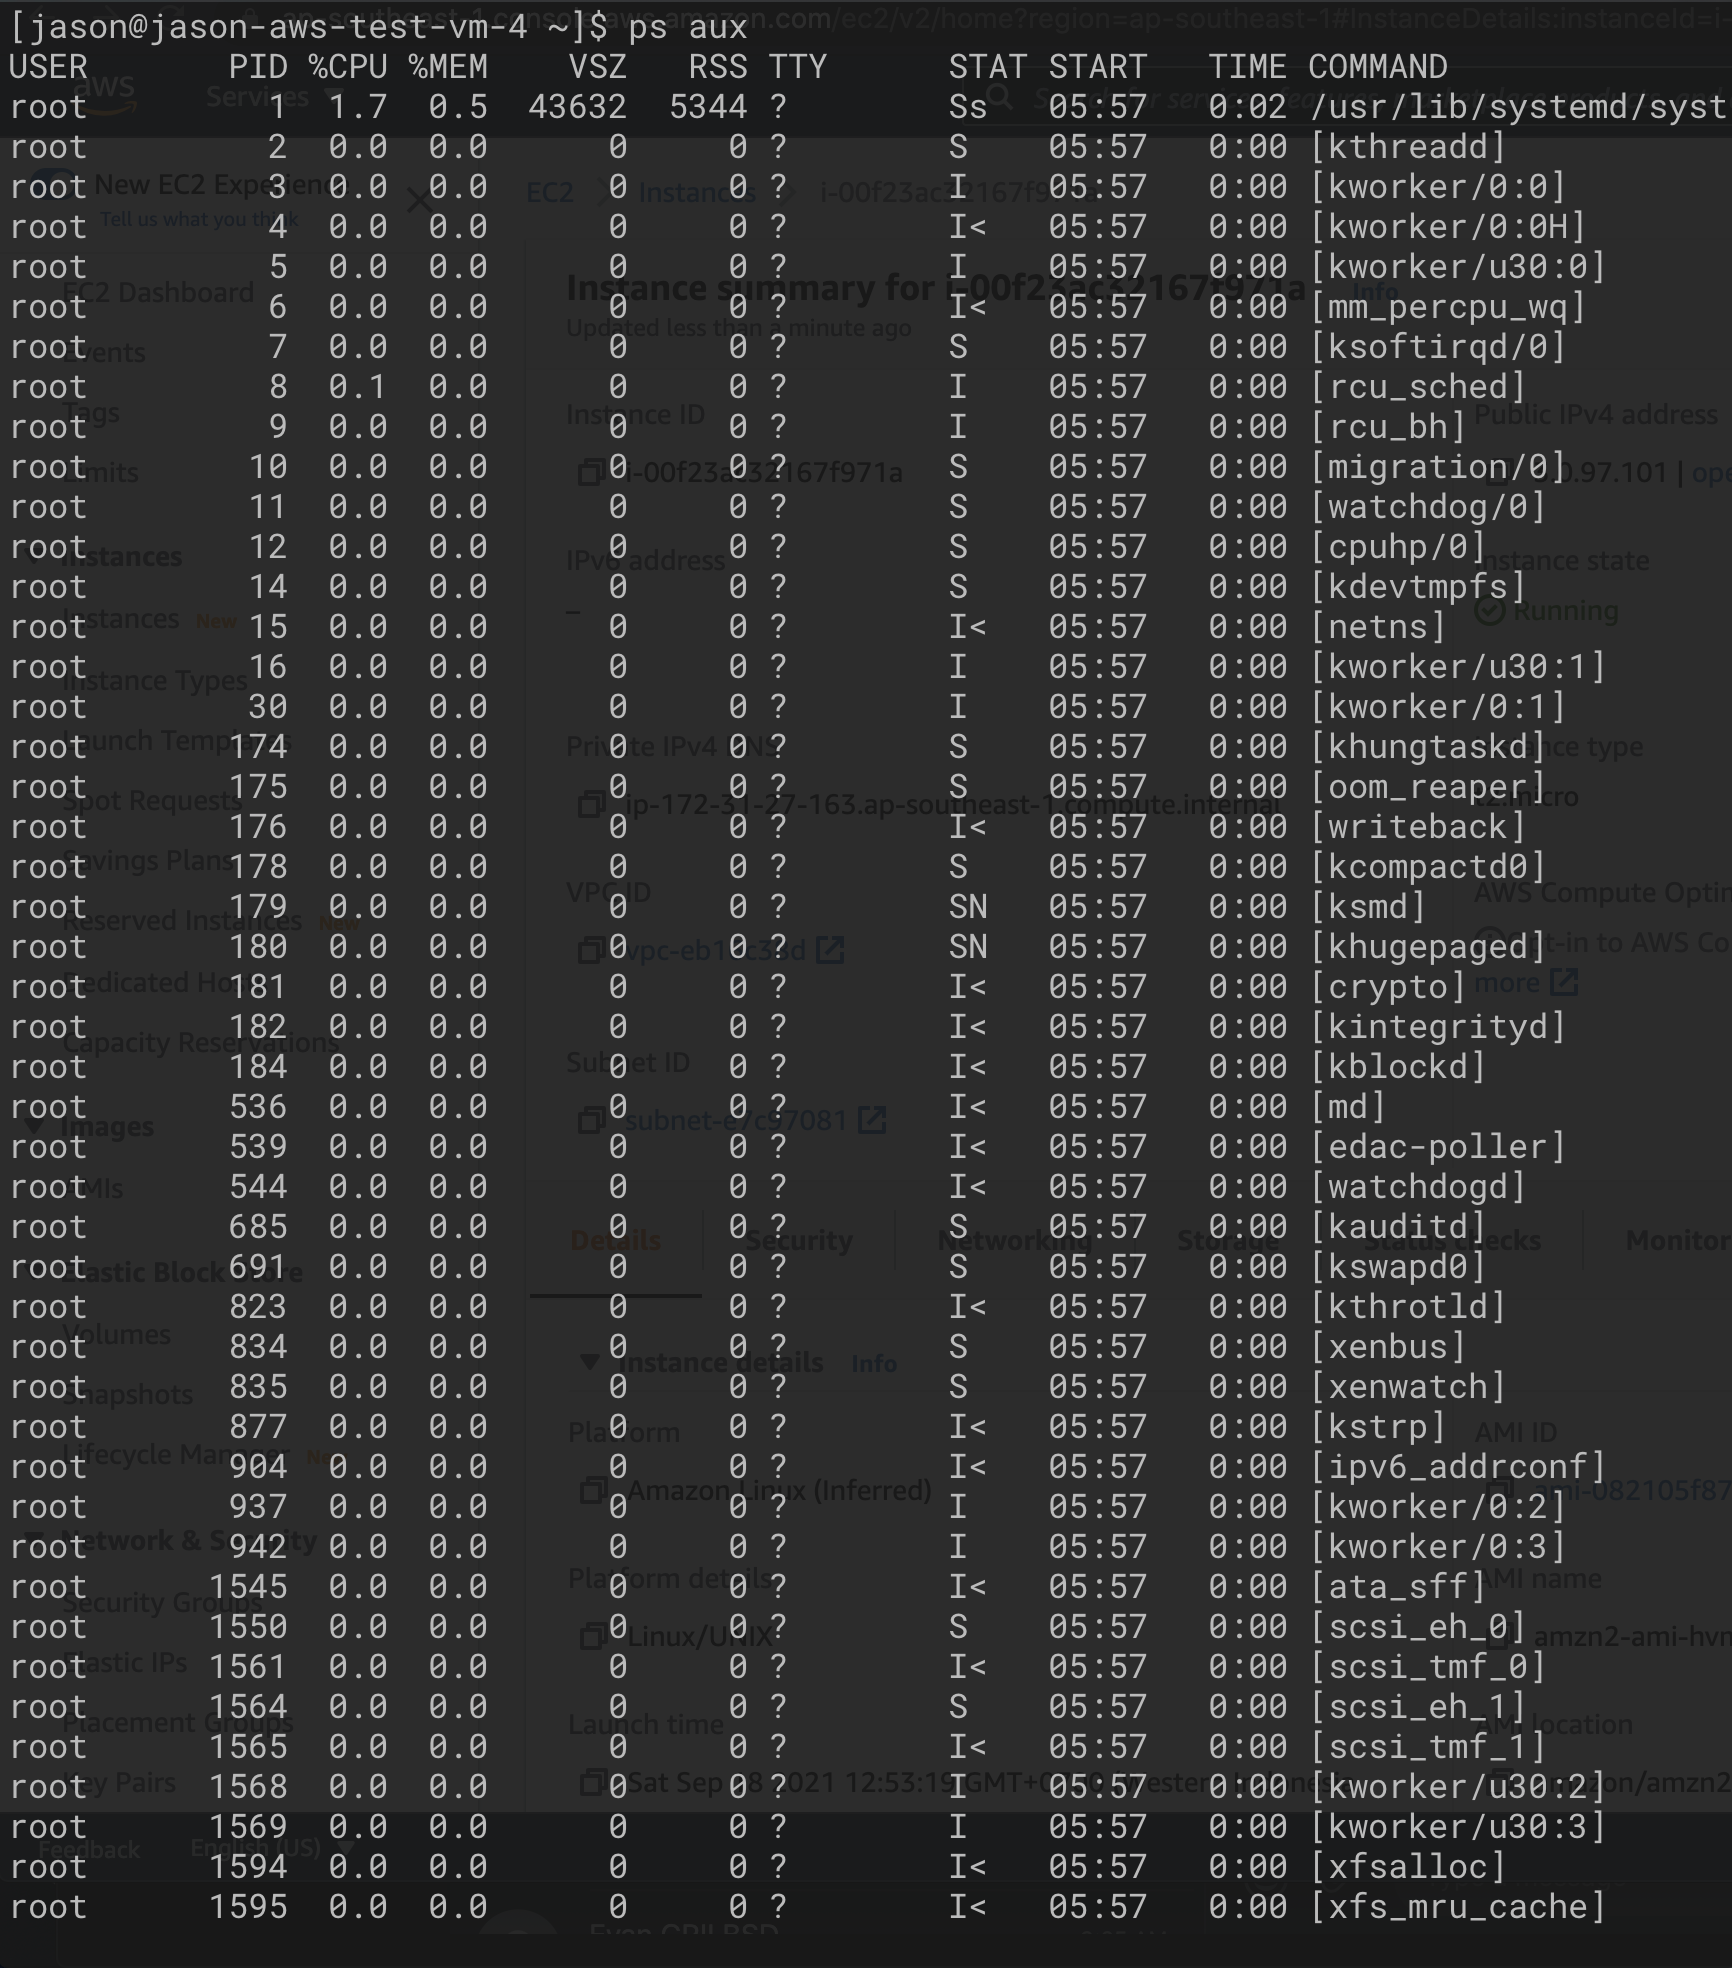
With a, u, and x options, you can get a more detailed output:
$ ps aux

The new categories of the expanded output include:
USER: The name of the user running the process.
%CPU: The CPU usage percentage.
%MEM: The memory usage percentage.
VSZ: Total virtual memory used by the process, in kilobytes.
RSS: Resident set size, the portion of RAM occupied by the process.
STAT: The current process state.
START: The time the process was started.
For more options, you can consult man ps.
2. top#
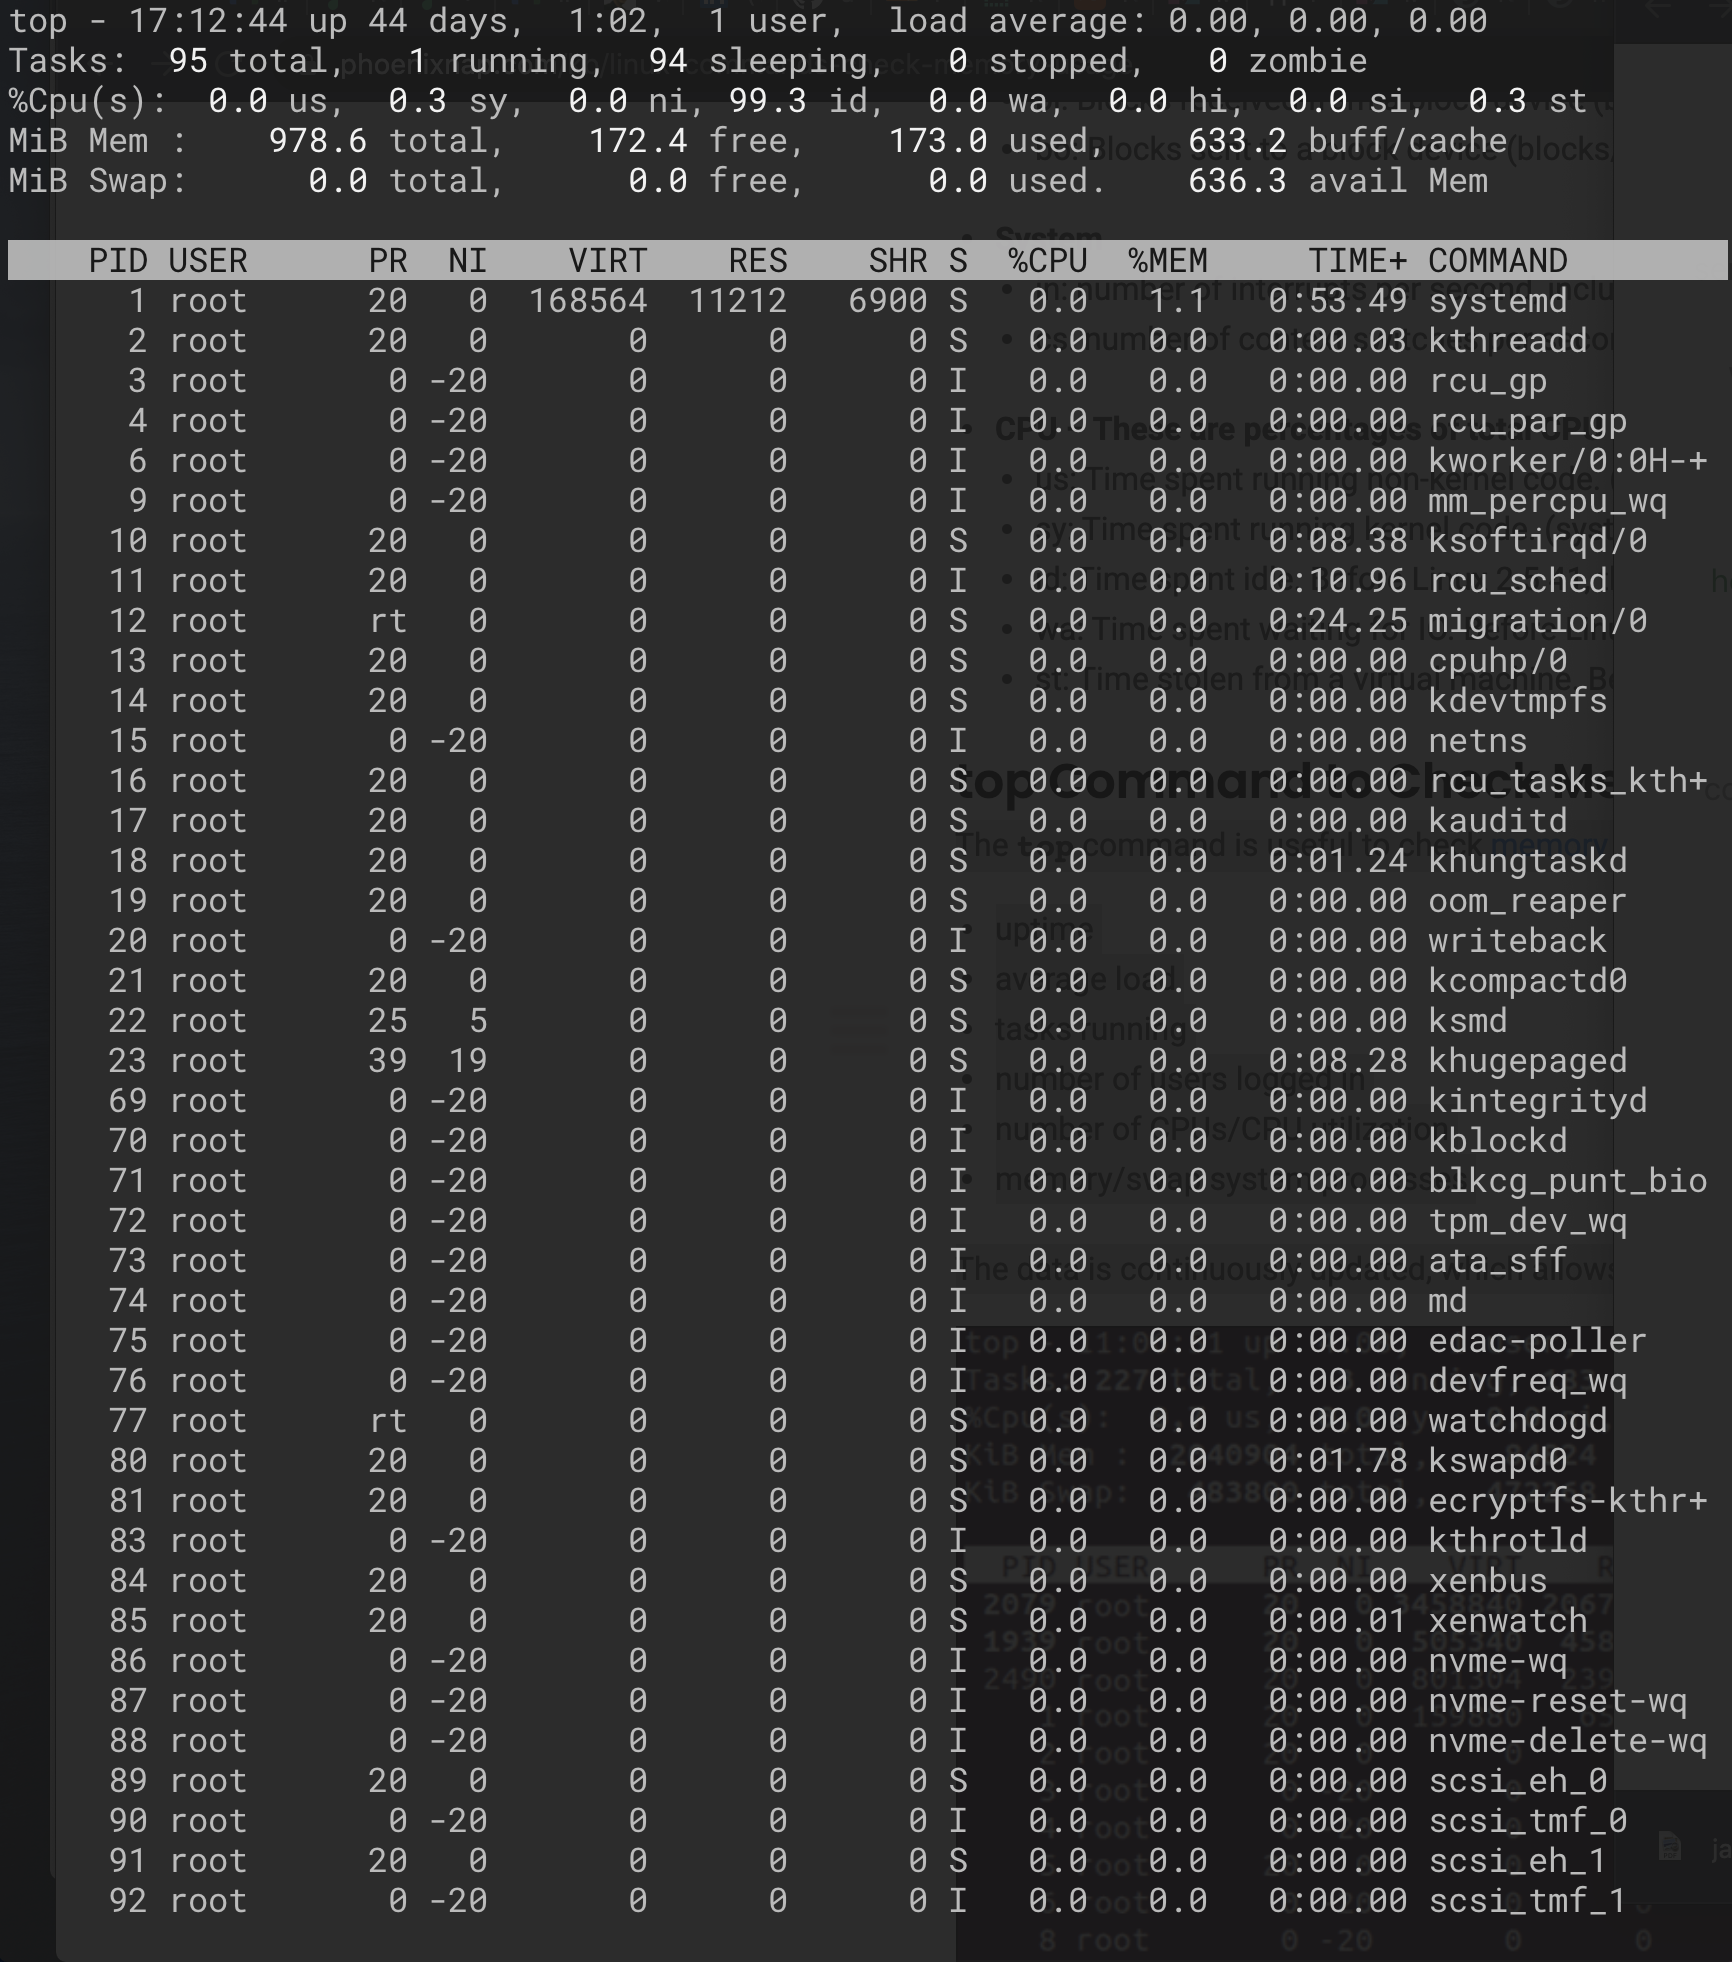
top displays the list of running processes, sorted by CPU usage, starting with
the heaviest one. The most intensive processes appear at the top of the list.

The output of the top command updates in real time, with the three-second
default refresh rate. The top command output contains the following categories:
PID: Process identification number.
USER: The name of the user running the process.
PR: The scheduling priority for the process.
NI: The nice value of the process, with negative numbers indicating higher priority.
VIRT: The virtual memory amount used by the process.
RES: The resident (physical) memory amount used by the process.
SHR: The total shared memory used by the process.
S: The status of the process - R (running) or S (sleeping).
%CPU: The percentage of CPU usage.
%MEM: The memory usage percentage.
TIME+: Total CPU usage amount.
COMMAND: The name of the command that started the process.
While the top command is running, use the following options to interact with it or change the output format:
c: Display the absolute process path. d: Change the output refresh rate to a user-defined value (in seconds). h: Display the help window. k: Kill a process by providing the PID. M: Sort the list by memory usage. N: Sort the list by PID. r: Change the nice value (priority) of a process by providing the PID. z: Change the output color to highlight running processes. q: Quit the command interface.
3. htop#
htop command offers the same output as the top command but in an
easier-to-understand and user-friendly way.
Since it usually does not come with most Linux distributions, you can install it with:
$ sudo apt install htop
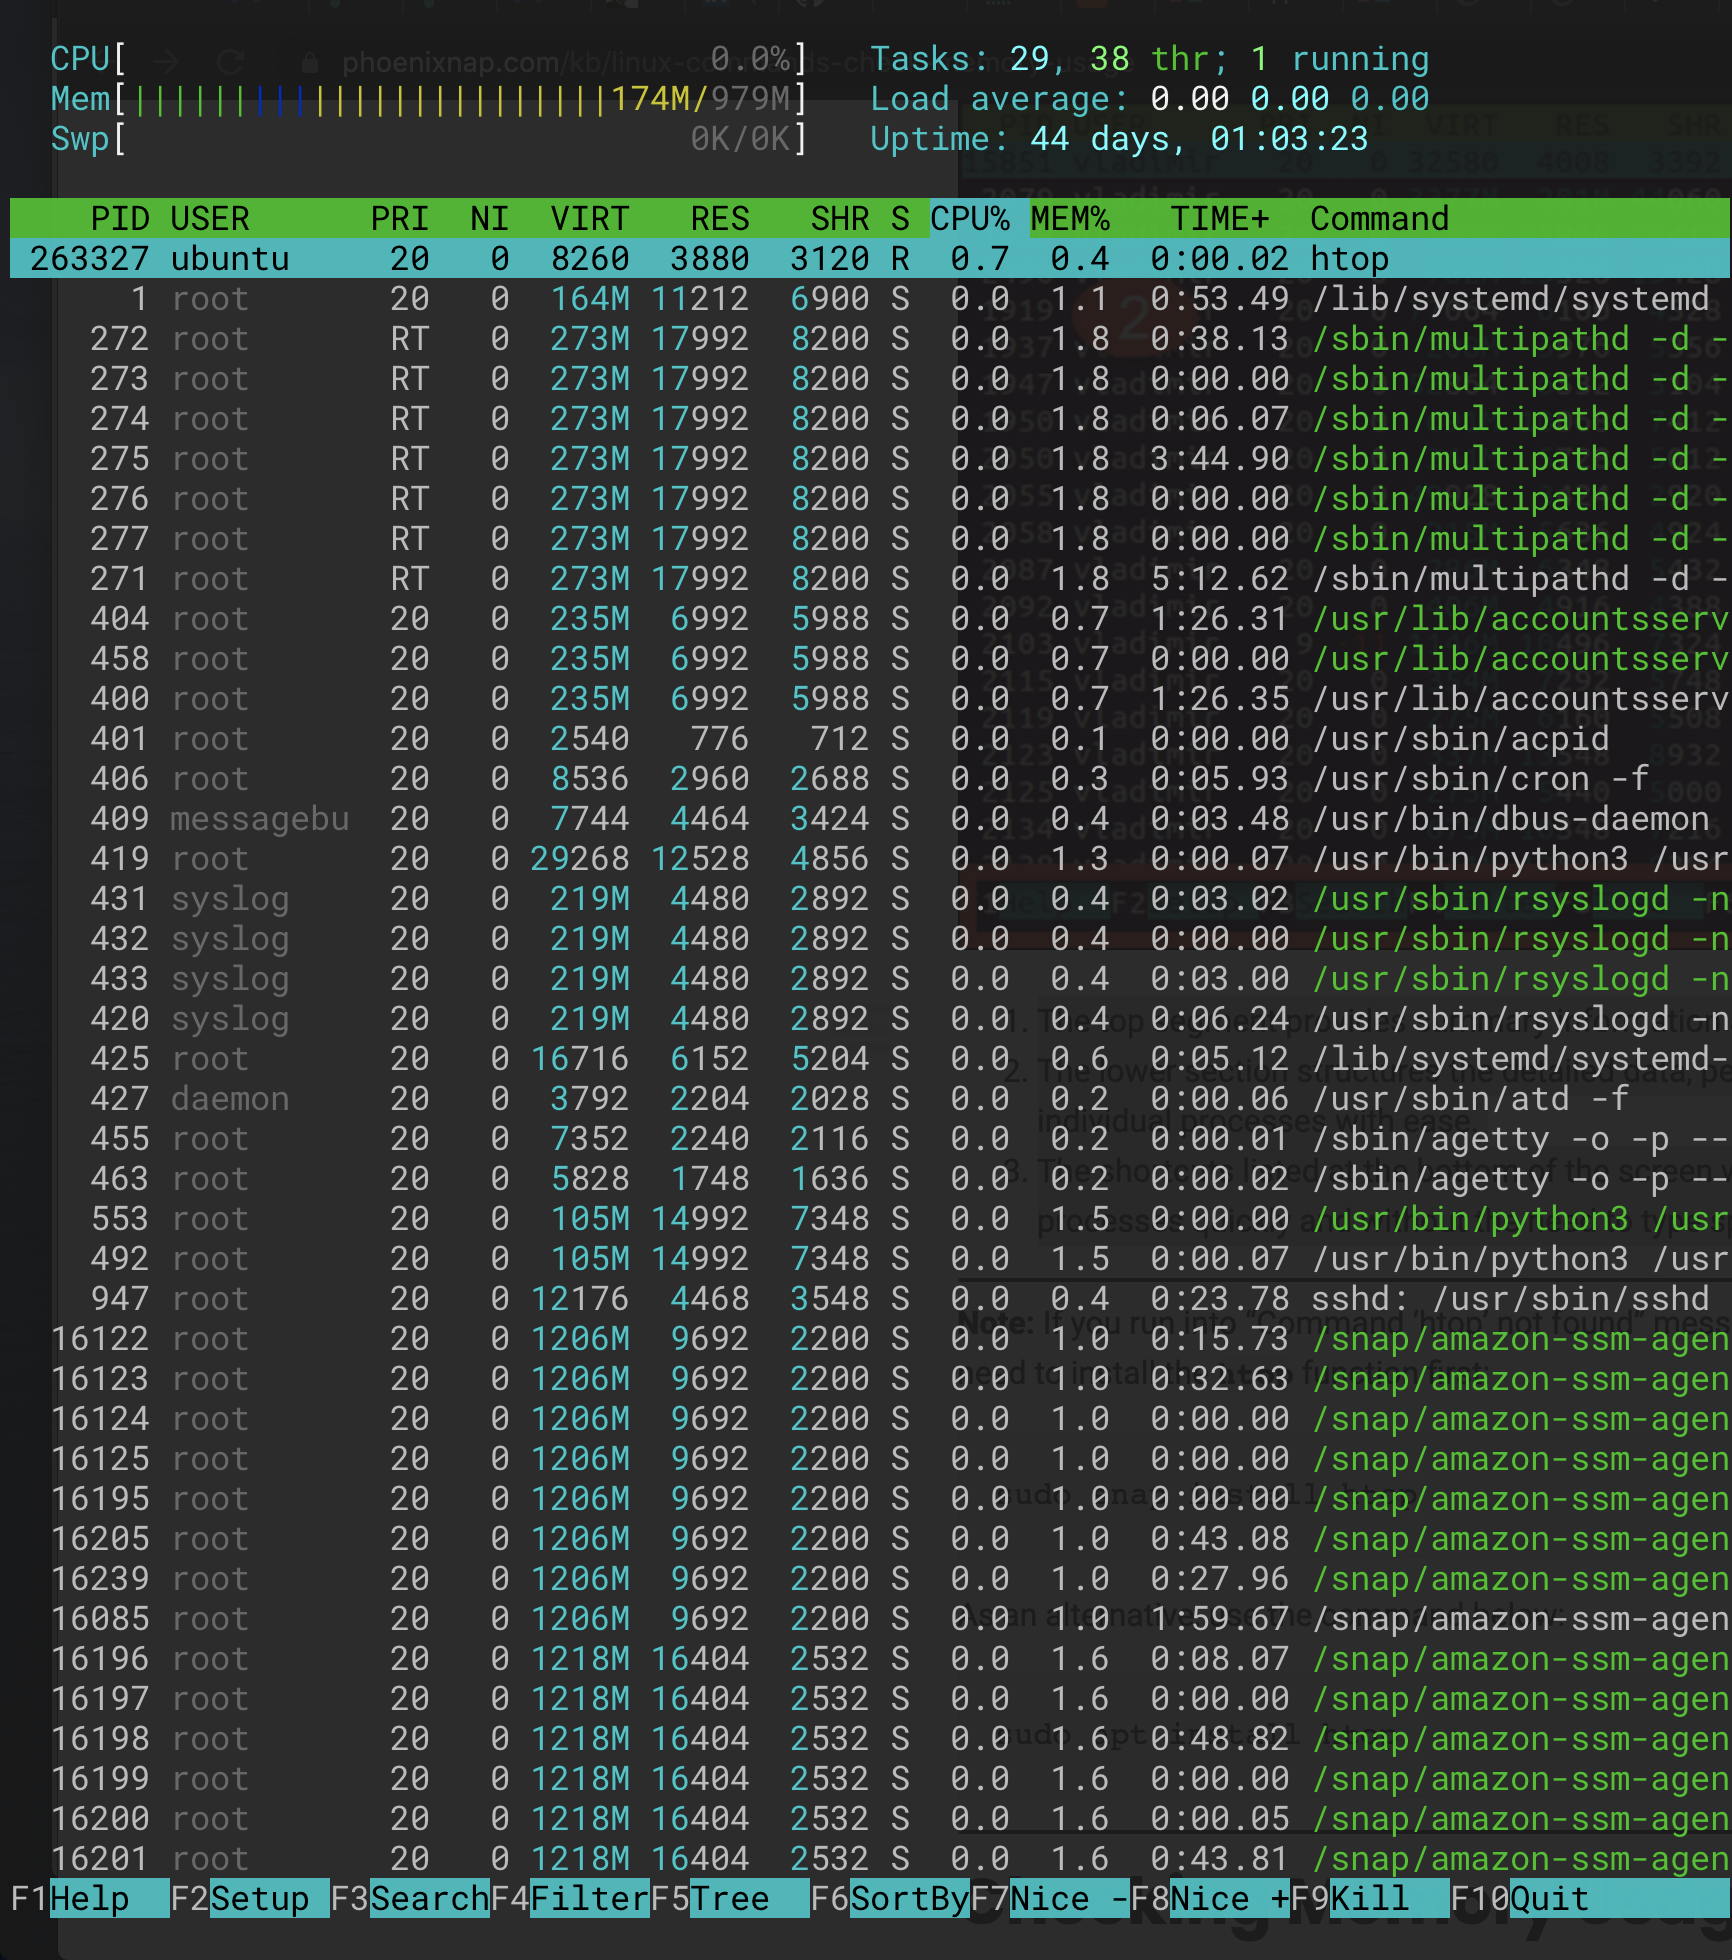
Using the htop command provides the following output:

Use the following keys to interact with the htop command:
Directional keys: Scroll the process list vertically and horizontally.
F1: Open the help window.
F2: Open the htop command setup.
F3: Search for a process by typing the name.
F4: Filter the process list by name.
F5: Switch between showing the process hierarchy as a sorted list or a tree.
F6: Sort processes by columns.
F7: Decrease the nice value (increase priority) of a process.
F8: Increase the nice value (decrease priority) of a process.
F9: Kill the selected process.
F10: Exit the command interface.
4. pgrep#
pgrep is a very useful command to findi process IDs. The syntax is as follows:
$ pgrep <process-name>
Let’s say we want to find the process id for the python process. You can run:
$ pgrep python
3685
Using the PID above, you can also search for more information on the process.
In the next example, using the PID 3685 provides information on the python3
process:
$ ps -e | grep 3685
